Cutting-edge analytic applications and reporting products enabling comprehensive views of care delivery across diverse healthcare settings that our clients can be confident in using to help inform important policy and decision making.
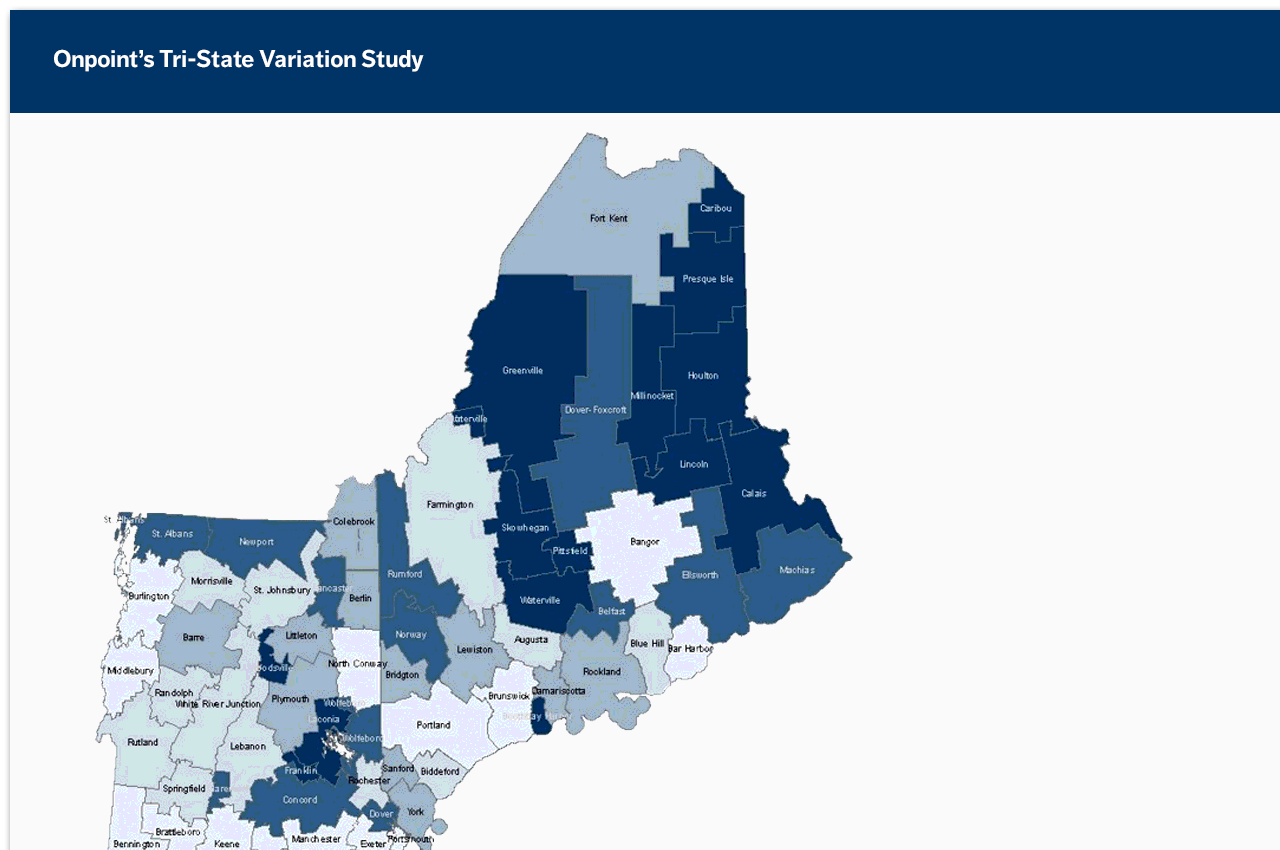
Our suite of analytic and reporting solutions employs the most advanced tools and methodologies, expansive measures production, and cutting-edge applications to enable comprehensive views of care delivery across service areas, providers, programs, and payers alike. Contemporary technologies, innovative products, and expert support services are key to providing high-quality solutions to our clients.
Comparative Cost Analyses: Our analytics team provides analytic support for bundled payment initiatives, primary care practice payment reform programs, hospital tiered benefit programs, and consumer transparency initiatives across the country. We were the first to employ the HealthPartners' Total Cost of Care (TCOC) framework to an all-payer claims database (APCD) data set and, ever since, have been generating TCOC results for health improvement initiatives in several markets; and, our comparative hospital cost analysis tool, which enables deep dives into drivers of hospital-cost variation, supports the development of multiple tiered benefit programs.
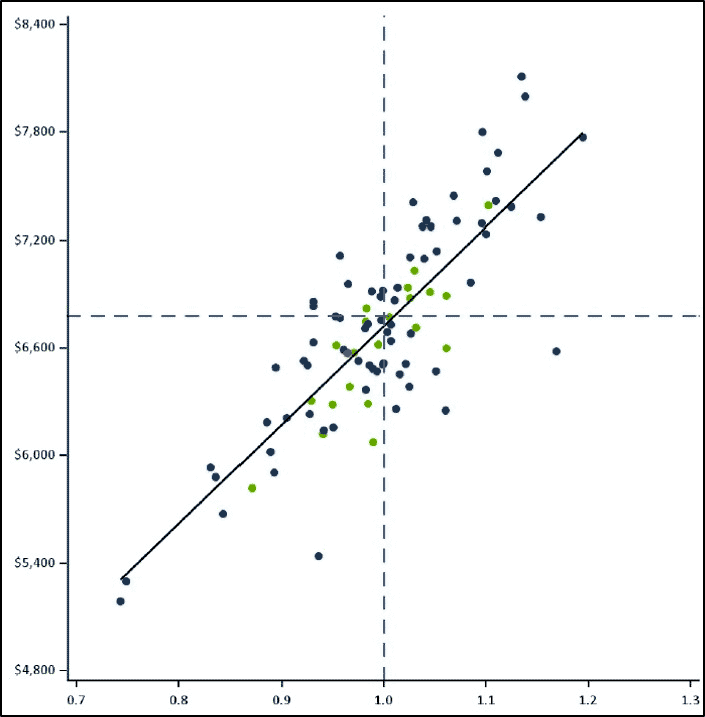 Geographic Variation Analyses: Our landmark tri-state variation study, examining variations in healthcare utilization and cost for commercial, Medicaid, and Medicare populations across Maine, New Hampshire, and Vermont, has served as the basis for a number of subsequent collaborative analyses, including the Dartmouth Institute’s multi-state Atlas reporting, a national demonstration of HealthPartners’ TCOC measurement system, and pediatric variation projects.
Program Evaluations: Our team of analysts apply contemporary health services research methods in conducting program evaluations for government and private health improvement initiatives, including patient-centered medical home models, disease management projects, and other programs.
Provider Reporting Systems: For several clients, we regularly generate comparative practice-, community-, and program-level profiles that feature a broad range of cost, utilization, and effective/preventive care measures (e.g., ACO, AHRQ, CMS, HEDIS, NQF, etc.) and which integrate APCD data sets with other statewide or regional sources. The profiles offer risk-adjusted comparisons to statewide, regional, and national rates as well as trends, 95% confidence intervals, and significance testing; Reporting solutions employ an array of data visualizations including scatter plots, heat maps, turnip graphs, and spider maps.
Special Studies & White Papers: Our team of analysts, researchers, and subject matter experts offer special guidance in how to address market and policy nuances using available data. Some of our latest work includes evaluations of outcomes associated with various medication and treatment options for opioid use disorder populations and of risk-adjustment approaches for the "whole-population" analyses of system and provider performance.
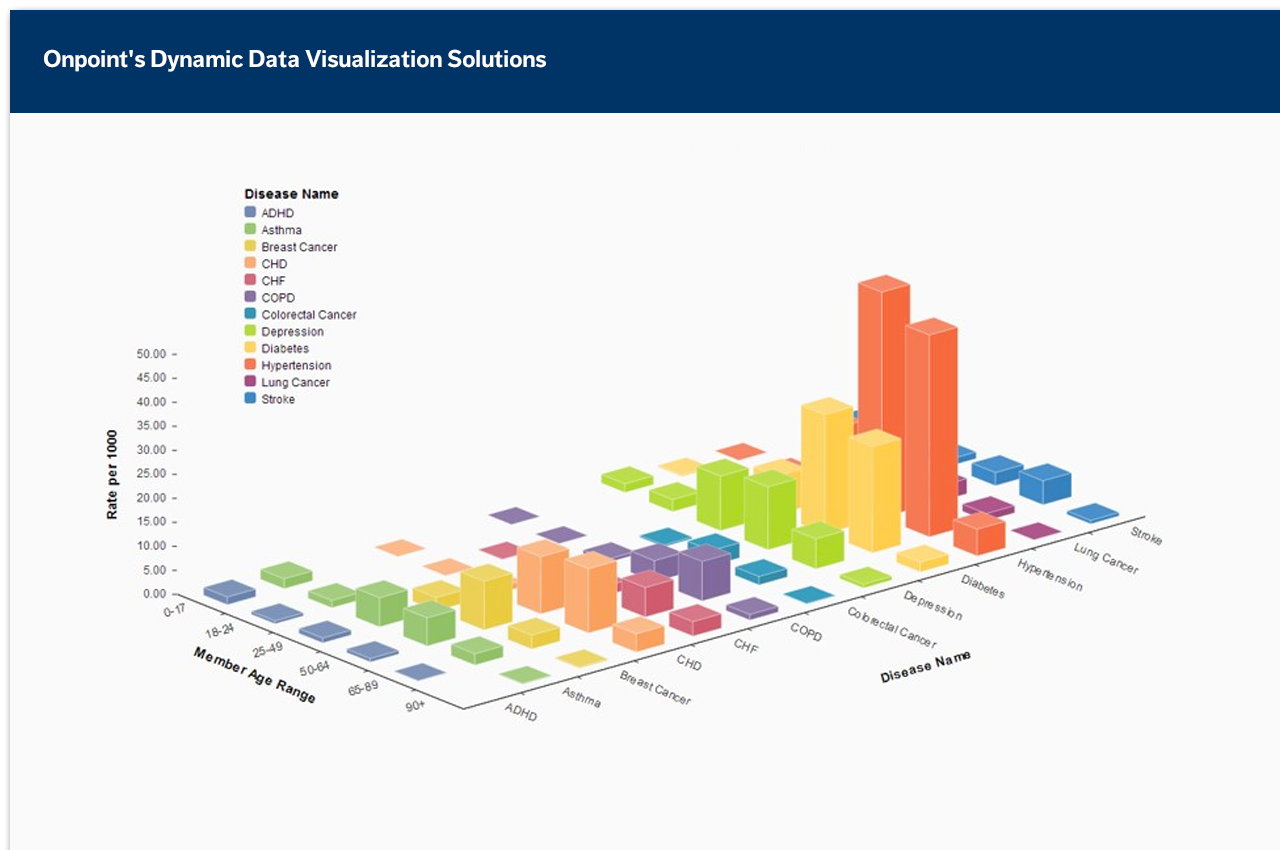
To convert data insights into tangible actions, our team has designed innovative ways of delivering our analytic and reporting solutions to key stakeholders more efficiently, securely, and intuitively than ever before. That way, users can conveniently study the health and performance of targeted patient populations and be confident in using the data to help inform important policy and decision making.
Analytic Enclave Environments: The Onpoint Analytic Enclave (AE) is a secure environment where authorized data analysts, scientists, and researchers alike can store, access, and interpret timely and actionable information. Highly advanced and highly scalable, Onpoint AE brings together cutting-edge infrastructure, user-friendly analytic applications, reliable support options, and contemporary security technologies and credentials, including compliance with HIPAA/HITECH regulatory requirements and the HITRUST common security framework. Applications widely adopted by Onpoint AE end users include R, SAS Office Analytics, SAS Visualize Analytics, Tableau, Toad, and the Microsoft Office Professional Suite among others.
Business Intelligence Solutions: "Black-box" data processing and transformations underlying proprietary solutions can be frustrating to clients. That's why Onpoint builds custom solutions leveraging the power of industry-leading tools on a transparent foundation of specific client and stakeholder requirements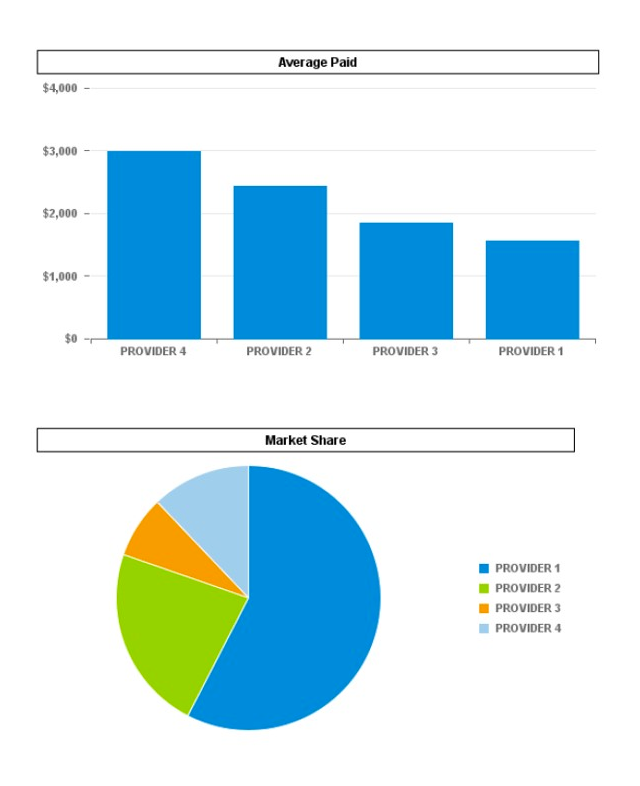 . Over the years, we have developed a spectrum of solutions including SAS-based self-service reporting systems for skilled analysts and more dynamic web-based reporting systems for novice users.
Data Warehousing and Extraction Services: Following data integration and enrichment processes, data are extracted from our operational data store (ODS) and placed into downstream data stores for analytic and reporting use. Depending on program needs, those downstream data stores are optimized for varying use cases, which enables diverse levels of querying sophistication and views of the data.
Performance Reporting Portals: The Onpoint Performance Reporting Portal (PRP) was designed carefully to help fill crucial information gaps and to address the need for greater transparency into the cost, quality, and utilization of services delivered across healthcare settings. The platform offers role-based user interfaces to view both summary- and patient-level reporting across a carefully curated set of measures enriched by comparative benchmarks and actionable filters. Core functionality allows users to quickly customize dashboard visualizations, drill down into a suite of sophisticated analyses, request “reconsideration” of posted results, and manage all relevant inputs to client-specific master provider directories. The result: a data set that most accurately reflects the quality and affordability of care provided to patients across health plans.
A unique know-how of health data and its inherent limitations is key to ensuring the success of our clients’ analytic goals. Our staff, expert in coding standards, claims adjudication processes, research methods and analytic tools, and privacy and security laws, assist our end-user community in better understanding data transformation activities to ensure complete buy-in of the data we deliver.
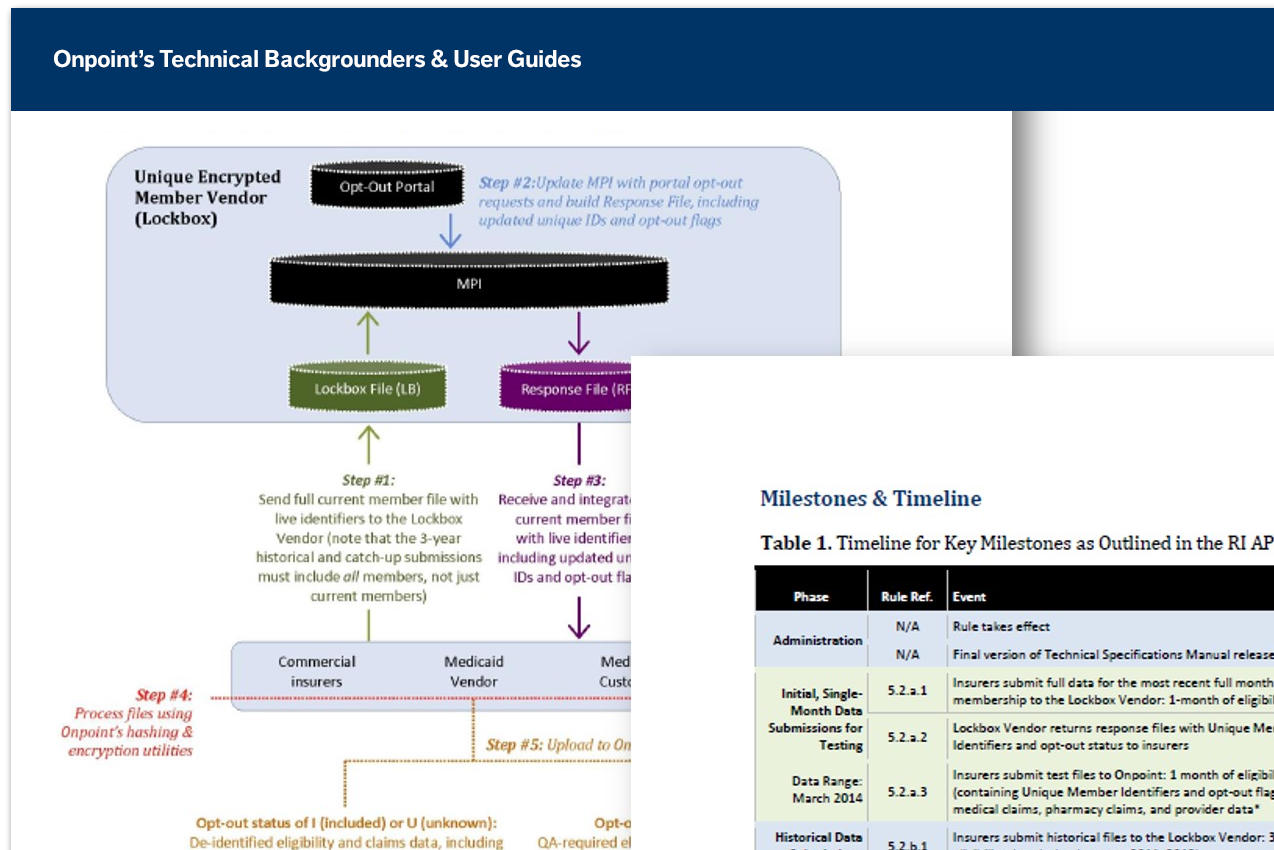
End-User Documentation: To build a transparent knowledge base for our end-user community, our team of project leads and supporting analysts produce a wide array of documentation, including data dictionaries, user guides, technical backgrounders, and data FAQs.
Online Collaboration: Onpoint’s interactive Collaboration Zone, powered by Microsoft SharePoint, is a secure, online hub tailored to the specific needs of clients and their end users, enabling stakeholders to share documentation, access key communications, exchange questions and ideas, and stay up to date through an intuitive user-friendly environment.
Tailored Training Programs: Online webinar trainings for clients and their stakeholders support knowledge transfer and cross-training needs on the data and its analytic use. Standard sessions include review of data and schema processes, end-user documentation, quality assurance procedures, and standard and client-specific value-add services.